Handling
paleomagnetic data in Microstation 3D-CAD
|
|
Small circle
methods require the combined handling of structural and paleomagnetic data
(bedding poles, remanences, small circles, small circle intersections). There
is currently no adequate software, but CAD-programs are an option. |
|
|
|
Microstation
is a three-dimensional CAD software for drawing and construction. Advantages
for palemagnetic work:
Disadvantages: Microstation is a professional
graphic software. It is complicated to start and get familiar with; no
equal-area projection is possible |
|
Getting started Microstation
is available from www.bentley.com.
Educational licences cost about 100 Euro. 3D-CAD programs require specific
training. Tutorials are found in the technical reference and on the website
of Bentley. Here we want to explain the most important differences to other
graphical programs and specifically show how to create and handle directional
data. |
|
Some important points
Most other functions are similar to desktop
publishing programs. |
|
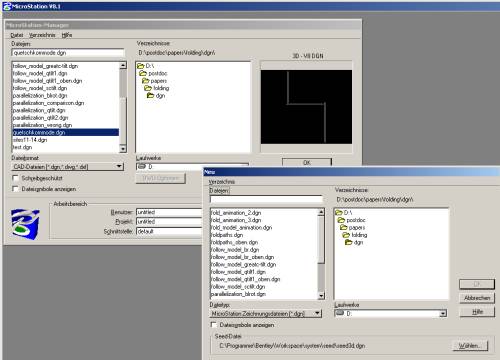
Setting up a data file for directional data First of all,
download a drawing of the unit sphere (download spheredgn.zip).
Then create a new 3D-file in the Microstation Manager (appears after start)
by File-New... Important: select seed
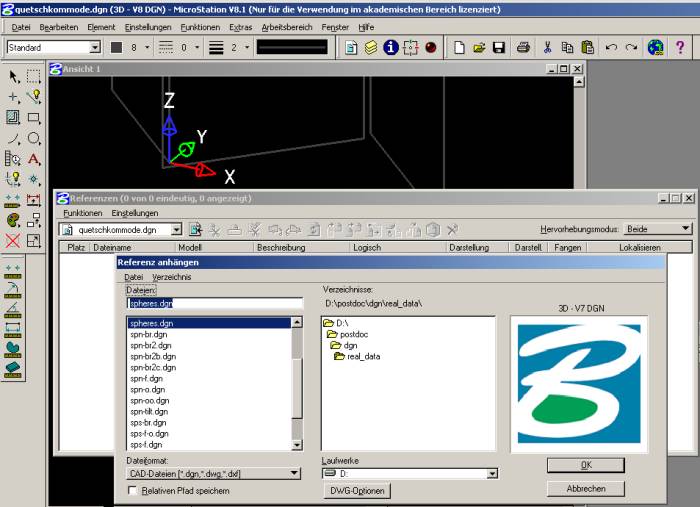
file seed3d.dgn, otherwise you end up in 2 dimensions. Then attach the file
spheres.dgn as an external reference file (File - Reference
- Functions - Attach...). External reference files cannot be
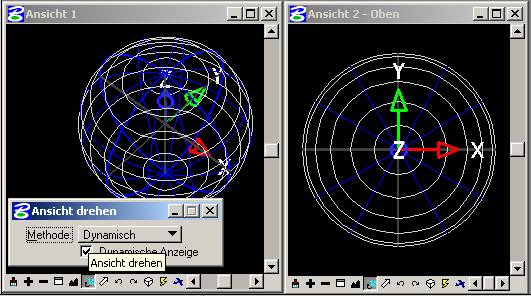
changed, but snapped to, selected and copied to clipboard. Open - or close -
the necessary windows and arrange them. Use Rotate View
(top, front, dynamic, etc.) to select different view directions for each
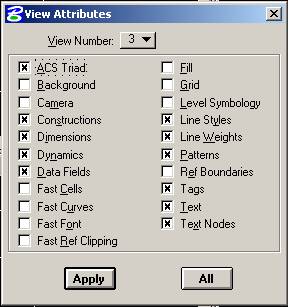
window. To see ACS-coordinate tripod enable ACS-Triad in Settings - View Attributes (ACS: Auxiliary coordinate
system). |
|
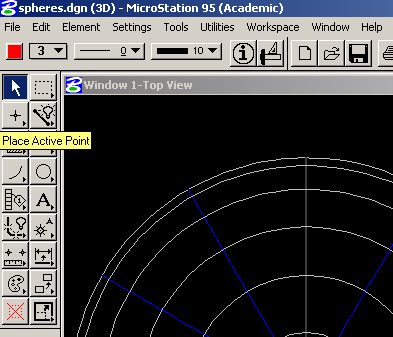
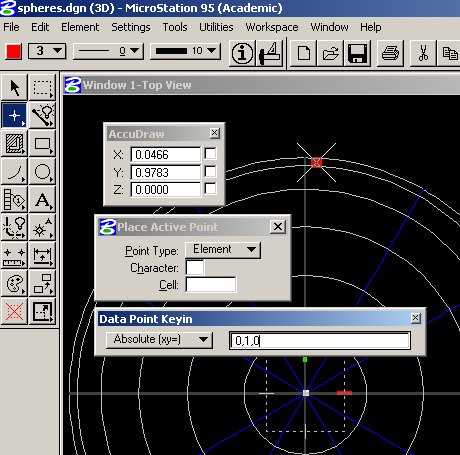
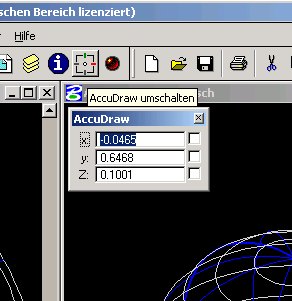
Drawing directional data: single point keyin and
script execution Single point keyin: Vectors
are represented as points on the surface of the unit sphere. These points are
created with the drawing tool place active
point. Be sure to first set the active color and
line weight to the desired values and to have activated
Accudraw. Then put the focus (mouse) on the Accudraw-coordinate box and press
P on the keyboard. The data point keyin box will
open and x,y,z can be typed in. |
|
Script execution: All
actions in Microstation can be written in ASCII-files which are executed as scripts
line by line. When creating larger data sets, such an Ascii-file
is produced with an Excel-template and executed
in Microstation. Simply select the worksheet area where the script is written,
copy and paste it as unformatted text to the Wordpad-program of Windows. Then
select one of the tab-characters and remove all of them with the replace
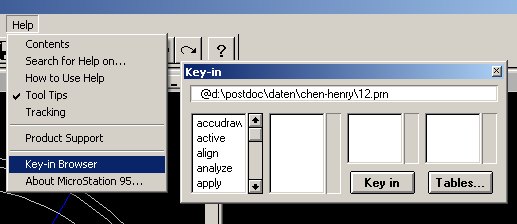
tool. Finally the file is saved in txt-format. Execution of a script file in
Microstation is as follows: In the Help-menue, open the Keyin browser,
then type @ followed by the path to the file (the file may have any
extension). Pressing return or click on key in executes the file. Caution:
any space character or other fault in the Ascii-file will prevent execution.
Create remanences and bedding poles subsequently. Then layers can be created
in the layer manager (with the names of the sites) and the data shifted to. |
|
Drawing great and small circles: Usually it
is sufficient to draw vertical small circles only as lines in the x-y plane.
If necessary, they can also be created as true circles using the tool place
circle. To draw a planar object, a view window must be oriented such that its
view plane is parallel to the plane of the object to draw. Then the center of
the object is defined by snapping a tentative point or a point keyin and then
the object's radius is defined. In most cases, it is easier to work with
scripts than manually create graphical entities. |
|
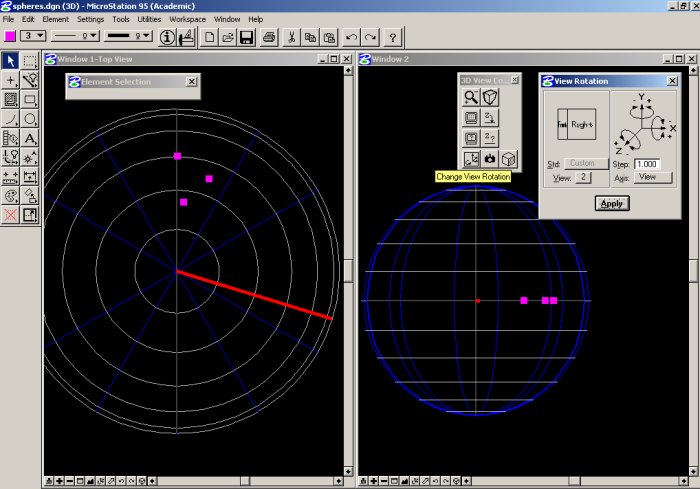
Rotating elements Precisely
rotating elements is already an advanced task in 3D-CAD. In Microstation
Accudraw and snap functions must be used. Unless special ACS (auxiliary
coordinate systems) are used, rotations are always going around axes parallel
to the view direction of a view window - perpendicular to the drawing plane.
In order to rotate around a specific axis, we first have to rotate one view
window to the desired position. This is done with the Change View Rotation tool from the 3D View Control
tool box (in the menu tool boxes). Type in a step in degrees, select a view
window (1, 2, ...) and then click on the rotation arrows of the tripod in the
tool box (at first sight this functionality is not evident). Make sure to
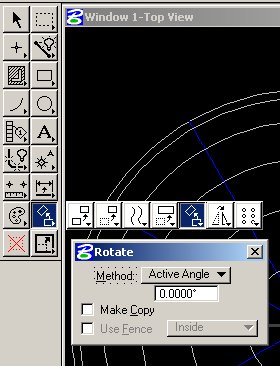
activate Accudraw. Select
the elements to rotate and choose the rotate
tool. Within the rotate toolbox, select the two points option for dynamic
interactive rotation with the mouse, or the active angle option for a fix
rotation angle. Then you are prompted to enter a pivot point (text line on
lower left of the screen) and here comes the critical action: The correct
pivot point is the center of the sphere with the coordinates (0,0,0). The
first option is to use the single point keyin (with the focus on the Accudraw
window, press P and type in 0,0,0 and press return; make sure to perform the
rotation in the correct window). The easier
way is to snap the center point (0,0,0). This is done by left+right clicking
with the cursor near the position of the center (in the window with the
intended rotation plane). Repeat until the text line in the status bar
displays the coordinates 0.0000, 0.0000, 0.0000. Confirm the snap selection
with a left-click. With the rotation option 2 Points and the cursor in the
rotation window, the Accudraw-compass will appear and you can interactively
rotate the selected objects by moving the cursor. Press the space bar (focus
on Accudraw tool box) to change the Accudraw coordinate readout from
Cartesian to polar coordinates. Right-click rejects action, left-click
confirms. To constrain the rotation angle during the action, put the focus on
the Angle field of the Accudraw tool box and type in the desired value. |
|
Writing coordinates to a file This option
is quite unique to Microstation (Autocad does apparently not have it) and a
crucial tool for us. However, the procedure is a bit puzzling and will
usually require several attempts. A useful hint: confirm text inputs with
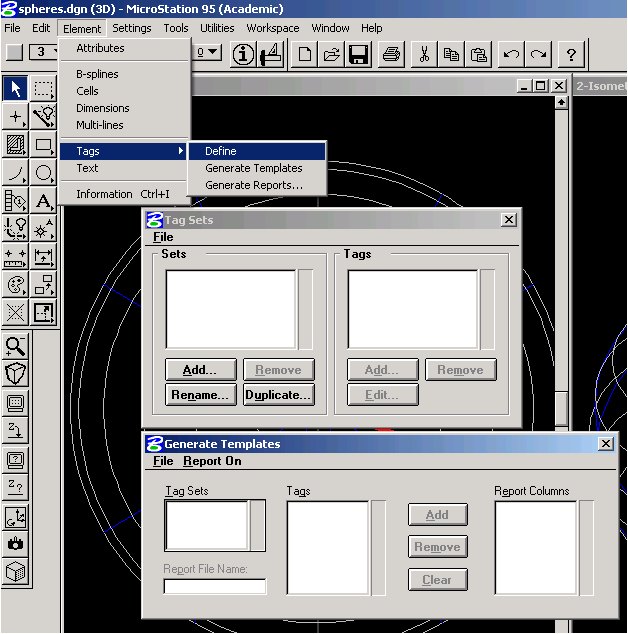
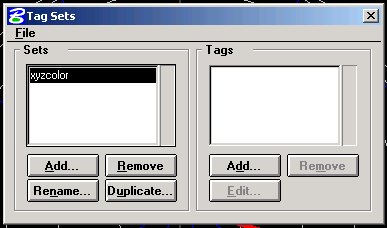
return and close each tool box before opening the next. First, a
tag set must be defined. In the main menu go to Element-Tags-Define. The Tag Sets box opens. Choose Add... and give a name, e.g. xyzcolor. Close the box (!)
and open the box Generate Templates from
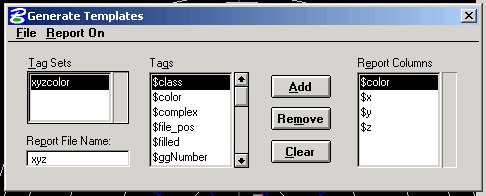
the same menu. The previously defined tag set xyzcolor will appear. Select
Report On All Elements, give it a Report File Name (e.g. xyz), press return
(!) and select the tags required ($color, $x, $y, $z). Choose File-Save and
give it a name (xyz.tmp). Now we have defined the tag set xyzcolor for
extracting the data, a report file name (xyz.rpt) and a template file xyz.tmp
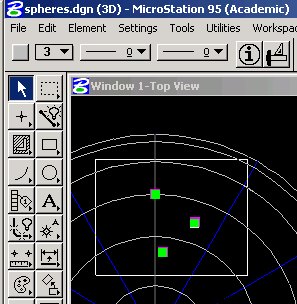
for recurrent use. Close the tool box. To make a
report, select the points coordinates should be written for. Then open the
box Generate Reports from the same menu. The xyz.tmp must appear,
double-click it to add it to the templates for reports and click Done. If
everything is right, the line Done Generating Reports appears on the lower
status bar. The report has usually been saved to
...Bentley\Workspace\Projects\Untitled\out\xyz.rpt. It can be opened with an
ASCII-editor or Excel. The coordinate numbers have to be divided by 10.000.
Should it be empty, something was wrong and you have to try again. Finally,
use xyz2DI.zip to convert x,y,z-values to D/I-values. |
|
·
Download example file script-ms.zip: Creates the remanence vectors of
19 different sites on 19 different layers in Microstation. ·
Download Excel file vectors2dgn.zip to create Microstation
script for remanences and bedding poles ·
Download example file spheredgn.zip: Unit sphere in Microstation ·
Download example file spheredwg.zip: Unit sphere in Autocad |
|
|
|
|